Short answer: NextEra Energy Resources has the largest US solar development pipeline in Enerdatics data, with about 23.2 GW of early-stage, late-stage and under-construction projects. Invenergy (about 10.4 GW), EDF (about 9.6 GW), GoSolar (about 9.3 GW) and AES (about 6.8 GW) follow. The ranking changes by stage, which is why EPCs, suppliers and investors track it project by project in platforms such as Enerdatics.
How Enerdatics solves this
See your rivals' moves before the market does: Enerdatics tracks who your competitors advise, buy from, build for, supply and fund. Company profiles pull every deal, project and financing into one view, updated as new records land. If you sell to developers, this is how you see who is about to need an EPC, a buyer or financing before your competitors do.
Enerdatics tracks 341 US solar M&A deals announced since January 2024, alongside more than 3,400 US utility-scale solar projects in development or construction. Available through CoreData, Stack dashboards, Leap AI and API.
Key takeaways
- NextEra Energy Resources holds about 23.2 GW of US solar in development or construction in Enerdatics data, more than twice the next developer.
- Enerdatics records about 553 GW of US utility-scale solar across 3,467 projects that are early-stage, late-stage, ready-to-build or under construction.
- Early-stage capacity (about 329 GW) is roughly six times the solar now under construction (about 56 GW), so most pipeline megawatts are still years from power.
- Invenergy leads the under-construction ranking with about 3.7 GW, ahead of NextEra at about 2.5 GW and Cypress Creek Renewables at about 2.1 GW.
- A pipeline ranking shows who is likely to sell, finance, hire an EPC or sign a PPA next, which an operating fleet ranking cannot show.
What counts as a solar developer's pipeline?
A developer's pipeline is the set of projects it controls that are not yet operating. In this post, that means four stages recorded in Enerdatics: early-stage, late-stage, ready-to-build and in construction.
Early-stage projects have been announced or filed, often with land and a queue position but few permits. Late-stage projects hold key approvals, such as environmental or land use permits. Ready-to-build means the project has reached notice to proceed (NTP), the point where the owner tells the contractor to start work. In construction means work on site has begun.
The ranking uses the company that holds each project now. Developer tags go stale when projects change hands, so current ownership gives a cleaner picture of who will make the next decision on each site.
Capacity is measured in megawatts (MW) of alternating current where the source reports it. One gigawatt (GW) equals 1,000 MW.
Who are the largest solar developers in the US by pipeline?
NextEra Energy Resources is first by a wide margin. Enerdatics records about 12.3 GW of NextEra solar at early stage, 8.4 GW at late stage and 2.5 GW under construction, for a combined 23.2 GW.
Invenergy is second at about 10.4 GW. Its mix is weighted toward the later stages, with 4.4 GW late-stage and 3.7 GW in construction. That makes it the largest builder of US solar right now in Enerdatics data.
EDF sits third at about 9.6 GW, split almost evenly between early-stage and late-stage projects. GoSolar is fourth at about 9.3 GW, all early-stage and spread across just six projects, so its position rests on a few very large sites.
AES, Doral Energy, Intersect Power, Hecate Energy, Apex Clean Energy and ENGIE complete the top ten, each with between 5.4 GW and 6.8 GW. The full ranking is in the table further down.
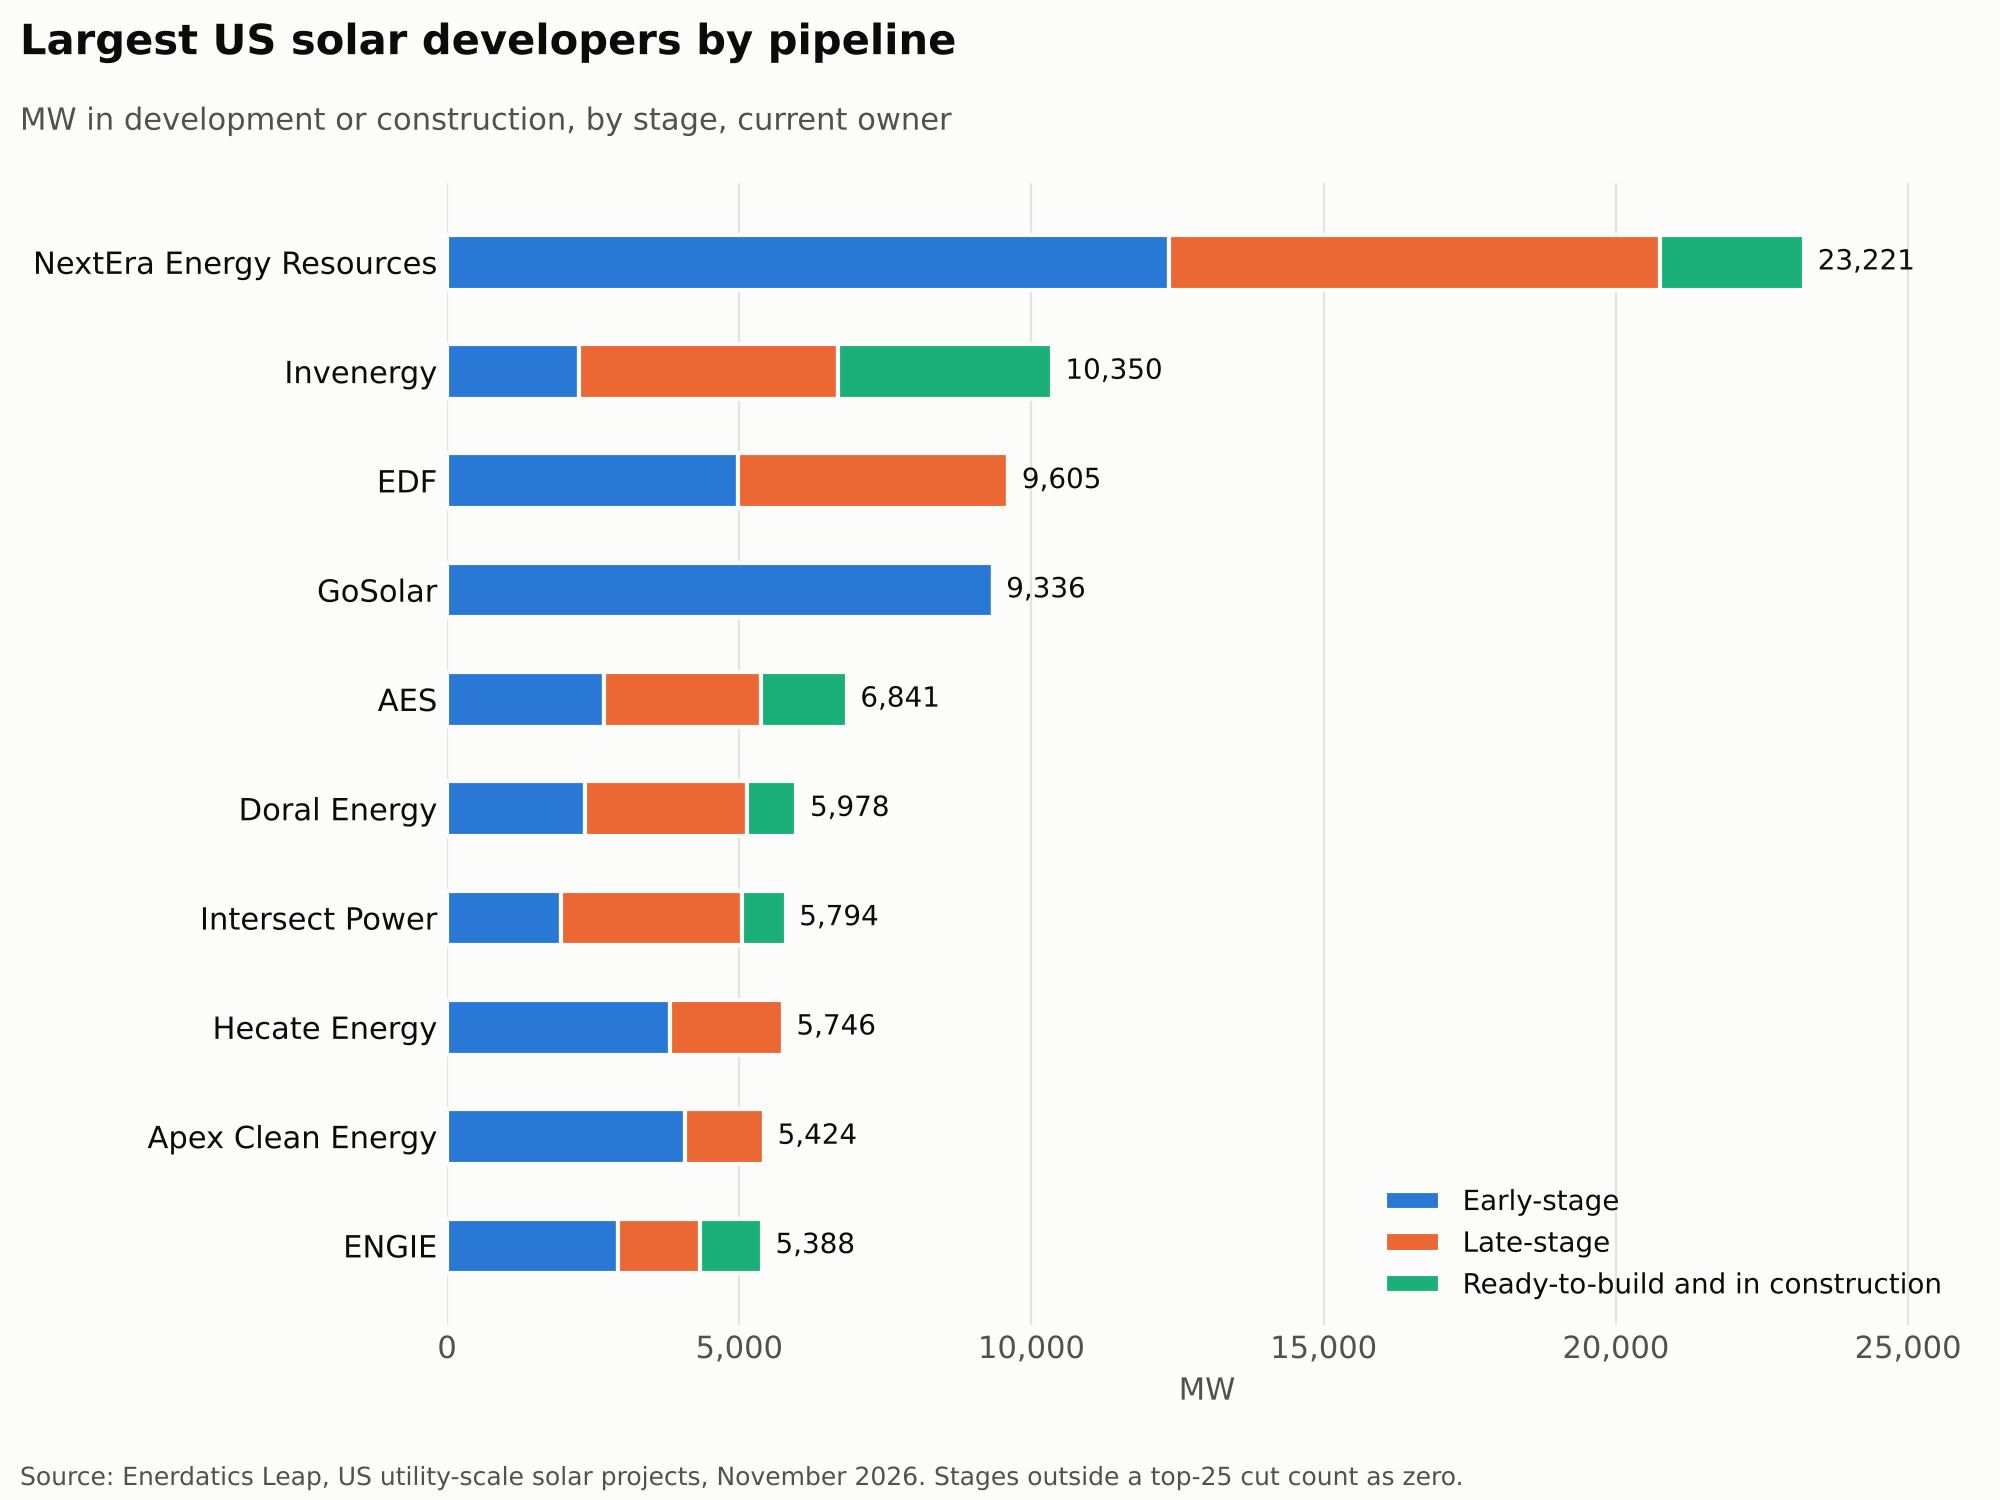
A few names rank high in one stage only. Cypress Creek Renewables has the largest ready-to-build solar position, at about 817 MW, and 2.1 GW under construction. TotalEnergies has about 4.5 GW of late-stage solar. Dominion Energy, a regulated utility, has about 1.7 GW under construction.
Why does the pipeline ranking differ from the operating fleet ranking?
An operating fleet ranking shows who owns the most solar that already produces power. A pipeline ranking shows who will add the most solar next. The two lists overlap at the top but split further down.
NextEra leads both. Enerdatics records about 19.7 GW of operating US solar owned by NextEra, against 23.2 GW in its pipeline. Below NextEra, the lists diverge. Owners such as Clearway Energy, Silicon Ranch and Origis Energy rank high on operating capacity, while developers such as GoSolar, Hecate Energy and Doral Energy rank high on pipeline but do not appear among the 20 largest operating owners.
The gap matters for anyone selling into the market. A large pipeline means near-term demand for interconnection studies, EPC contracts, modules, tax equity and offtake. A large operating fleet means demand for asset management, refinancing and repowering. Enerdatics tracks the companies that win those contracts, so you can see which rival is already working for each developer.
Pipelines also change hands. Developers often sell projects at ready-to-build to owners with cheaper capital. The recent purchase of de-risked Arizona solar by Chrysalis Renewables from Hanwha is one example of how late-stage capacity moves from developer to long-term owner.
Where is the US solar pipeline held up?
Most of the pipeline is waiting on grid access. An interconnection queue is the list of projects that have asked a grid operator, such as PJM or ERCOT, to connect to the transmission system.
Lawrence Berkeley National Laboratory counted about 773 GW of solar actively seeking interconnection at the end of 2025, down 19% from a year earlier. It also found that only 13% of capacity requested between 2000 and 2020 had reached commercial operation by the end of 2025. The typical time from request to operation now exceeds five years in regions with data.
That is why early-stage megawatts should be read with care. Enerdatics records about 329 GW of early-stage US solar, against about 56 GW in construction. Only part of the early-stage total will be built.
Federal reform aims to speed this up. FERC Order No. 2023 moved grid operators toward cluster studies, where projects are studied in groups rather than one by one, and added readiness tests such as site control and deposits. Enerdatics mapped the commercial side of this in its report on M&A signals from the queue.
How do tax credit deadlines change the ranking?
They reward developers that can start construction early. Section 48E is the investment tax credit (ITC) and Section 45Y is the production tax credit (PTC) for clean electricity projects.
Under the 2025 budget law, solar projects that begin construction after July 4, 2026 must be placed in service by the end of 2027 to claim either credit. IRS Notice 2025-42 also removed the 5% cost safe harbor for most solar projects. Developers now need to show physical work of a significant nature, such as excavation or installing key components.
The effect shows up in construction data. The US Energy Information Administration expects 43.4 GW of utility-scale solar to come online in 2026, a record, with Texas alone accounting for about 40%. SEIA and Wood Mackenzie reported that utility-scale installs rose 61% year on year in the second quarter of 2026 as developers raced the deadline.
Developers with large late-stage and in-construction positions, such as Invenergy, NextEra and Cypress Creek, are best placed to keep their credits. Early-stage-heavy pipelines carry more risk of delay, sale or cancellation.
How should you use a developer ranking?
Use it to decide who to call first. EPCs and equipment suppliers can target developers with large late-stage and ready-to-build volumes. Tax equity investors and lenders can focus on projects approaching construction. Buyers can watch early-stage-heavy developers that may sell projects to fund the rest.
Then check the detail behind each name. Pipeline totals hide project size, state, grid market and offtake. A developer with 5 GW across 30 projects in PJM behaves differently from one with 5 GW across three projects in the desert Southwest.
| Rank | Developer (current owner) | Early-stage MW | Late-stage MW | Ready-to-build and in construction MW | Total pipeline MW |
|---|---|---|---|---|---|
| 1 | NextEra Energy Resources | 12,350 | 8,407 | 2,465 | 23,221 |
| 2 | Invenergy | 2,251 | 4,434 | 3,664 | 10,350 |
| 3 | EDF | 4,982 | 4,622 | n/a | 9,605 |
| 4 | GoSolar | 9,336 | n/a | n/a | 9,336 |
| 5 | AES Corp | 2,691 | 2,680 | 1,469 | 6,841 |
| 6 | Doral Energy | 2,354 | 2,774 | 850 | 5,978 |
| 7 | Intersect Power | 1,950 | 3,095 | 749 | 5,794 |
| 8 | Hecate Energy | 3,810 | 1,936 | n/a | 5,746 |
| 9 | Apex Clean Energy | 4,068 | 1,356 | n/a | 5,424 |
| 10 | ENGIE | 2,930 | 1,398 | 1,060 | 5,388 |
Source: Enerdatics Leap, US solar projects by current owner and lifecycle stage, active records as of November 2026. n/a means the developer was outside the top 25 for that stage, so totals are floors.
Enerdatics' data shows that the ten largest developers together hold about 88 GW of US solar in development or construction, roughly 16% of the 553 GW pipeline. The rest is spread across hundreds of smaller developers, which is why buyers and suppliers need project-level data rather than a short list of famous names.
Frequently asked questions
Who is the largest solar developer in the US? NextEra Energy Resources has the largest US solar pipeline in Enerdatics data, at about 23.2 GW in development or construction. It also owns the most operating US solar, at about 19.7 GW.
How big is the US utility-scale solar pipeline? Enerdatics records about 553 GW of US utility-scale solar across 3,467 projects that are early-stage, late-stage, ready-to-build or under construction. About 56 GW of that is in construction.
Which developer is building the most solar right now? Invenergy leads, with about 3.7 GW of US solar in construction in Enerdatics data. NextEra follows with about 2.5 GW and Cypress Creek Renewables with about 2.1 GW.
Why do pipeline rankings change so often? Projects move between stages, get cancelled or are sold to new owners. Enerdatics ranks by current owner and updates records as new filings, deals and announcements land.
Does a large early-stage pipeline mean a developer will build it all? No. Berkeley Lab found that only 13% of capacity requested from 2000 to 2020 reached operation, so early-stage totals overstate what will be built.
Want the full pipeline for any developer on this list? Ask Leap three free questions, answered from Enerdatics data. No sales call needed.